Report
This guide provides a comprehensive overview of how to design, preview, and manage reports within the Synergy IDE's Report Designer.
The Report Designer in Synergy IDE allows you to create structured and dynamic reports with a visual, drag-and-drop interface. You can connect to data sources, apply styles, write expressions, and preview real data before publishing.
Reports can include headers, footers, detail bands, styles, localization, and custom logic — making it a powerful reporting solution for applications.
Accessing Report Designer
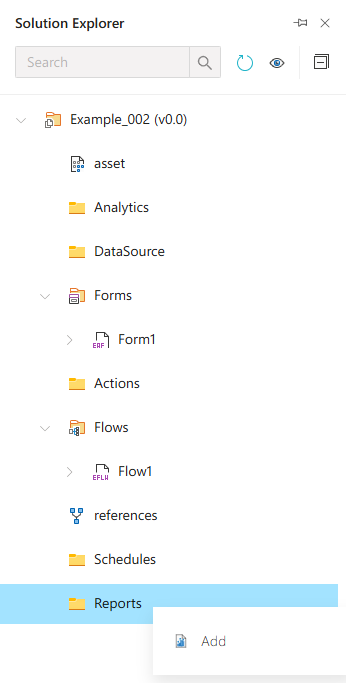
To begin working with reports:
- Go to the
Projectmenu in the IDE. - Select the
Reportstab. - Click
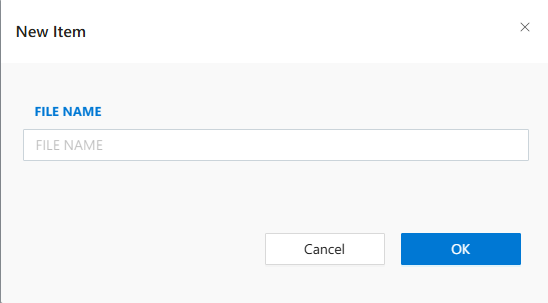
Add Reportto create a new report.
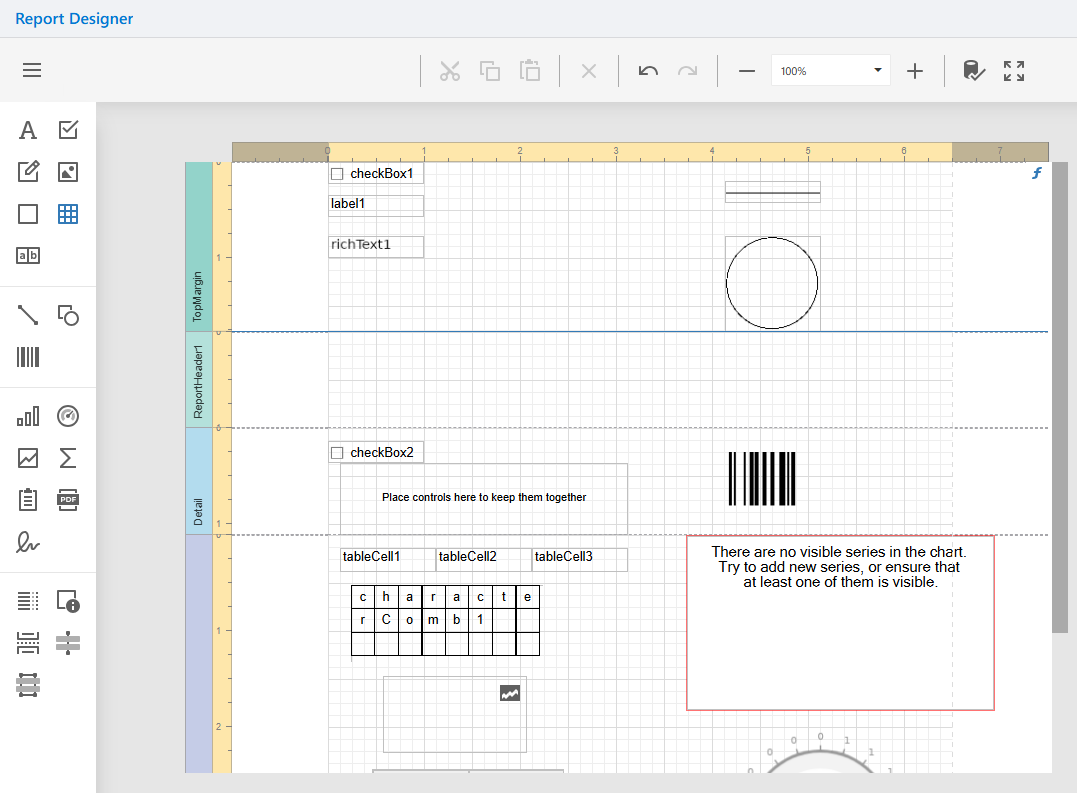
Launching the Report Designer
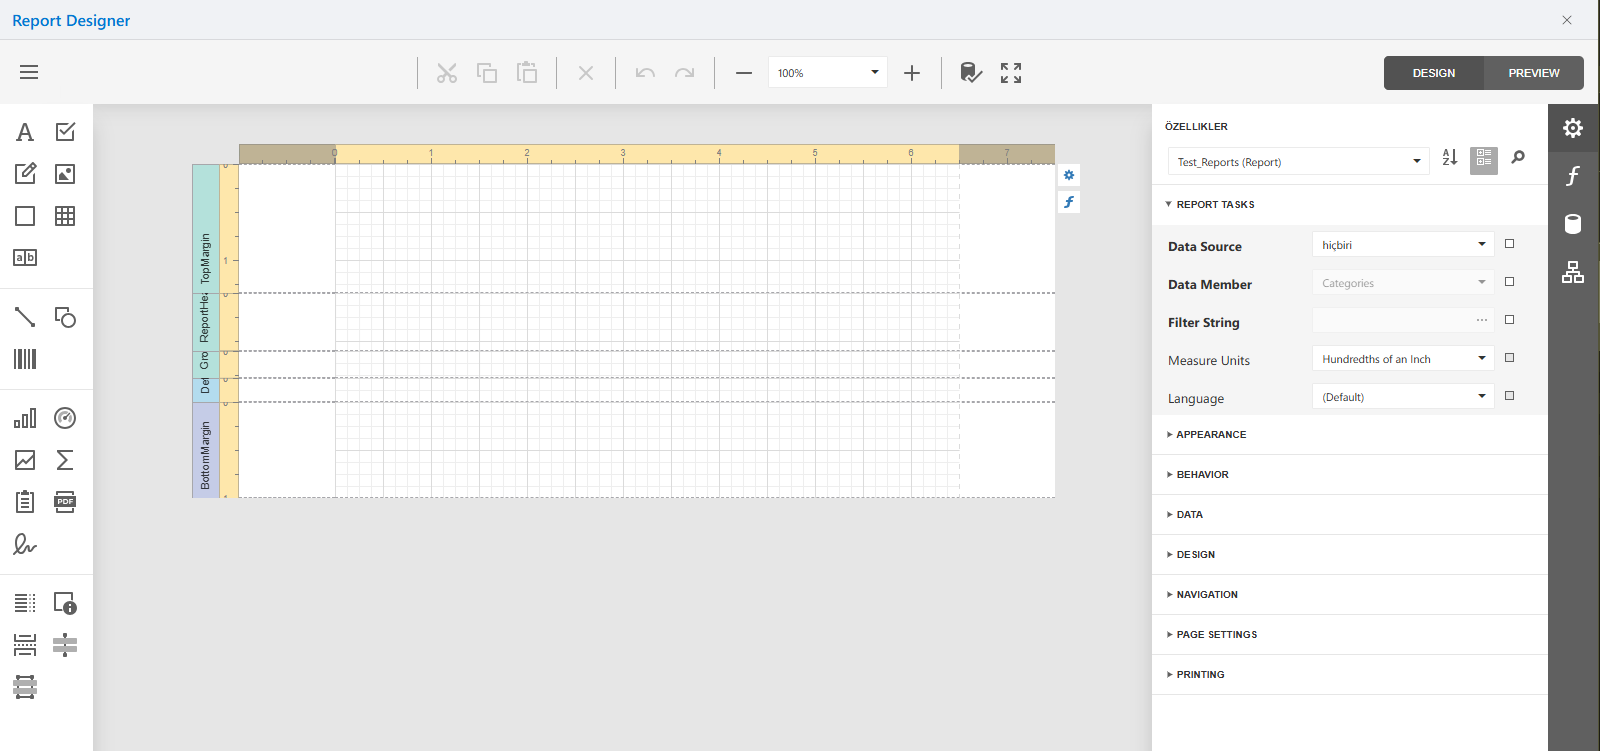
When you create or open a report, the Report Designer interface launches. It contains:
Design Surface— where you place and organize report elementsToolbar— for layout and structure toolsProperties Panel— for customizing styles, bindings, etc.Field List— to connect and drag fields from your data sourceReport Explorer— to view the report structure
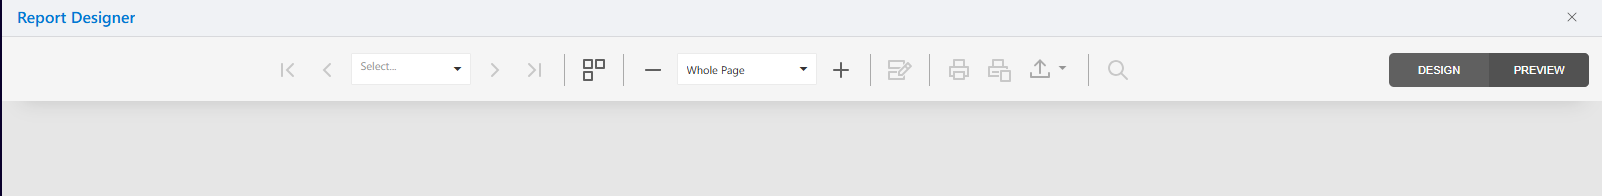
Report Designer Menu
At the top of the report designer is a toolbar that includes options for:
- Navigating pages
- Adjusting zoom level
- Previewing report
- Adding elements or bands
- Aligning and formatting items
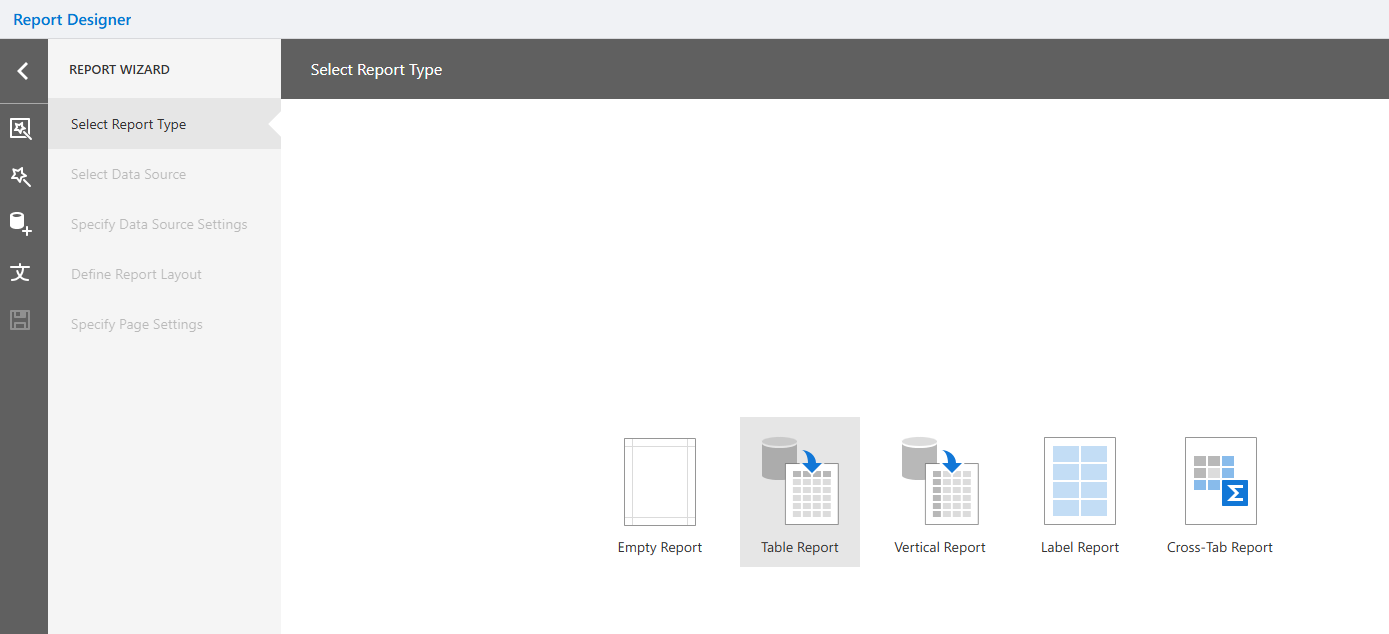
Creating a New Report via Wizard
To create a report using the wizard:
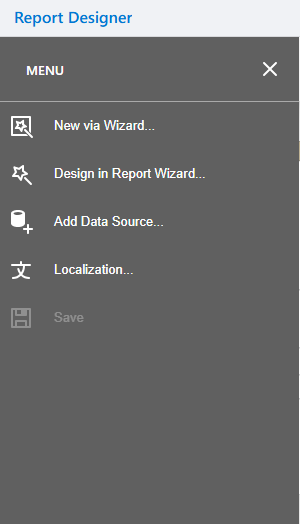
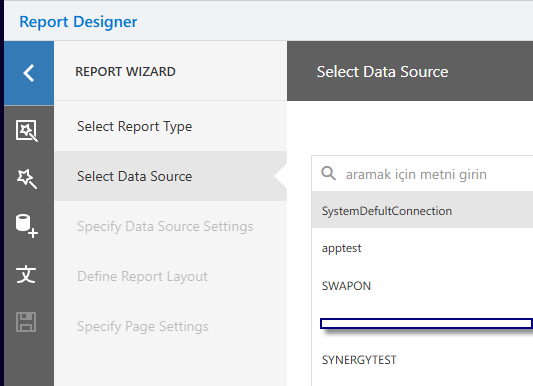
- Click the
+icon and chooseNew via Wizard. - Select a data source from the list.
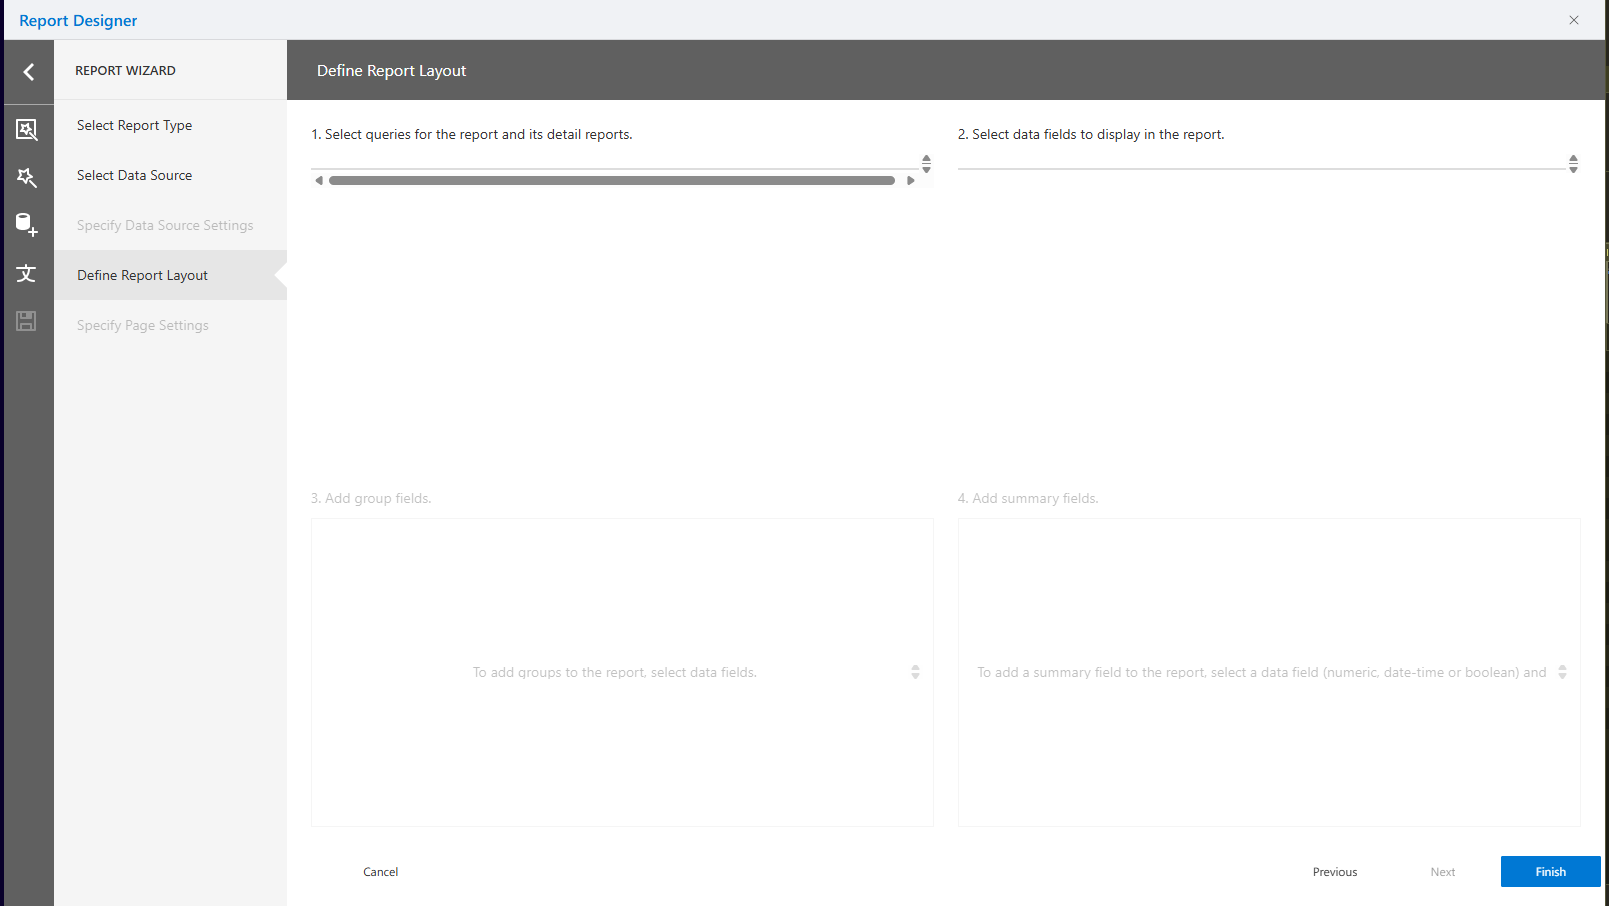
- Choose the layout structure and fields you want to include.
- Select a style or visual theme for the report.
This option simplifies the setup process for beginner users.
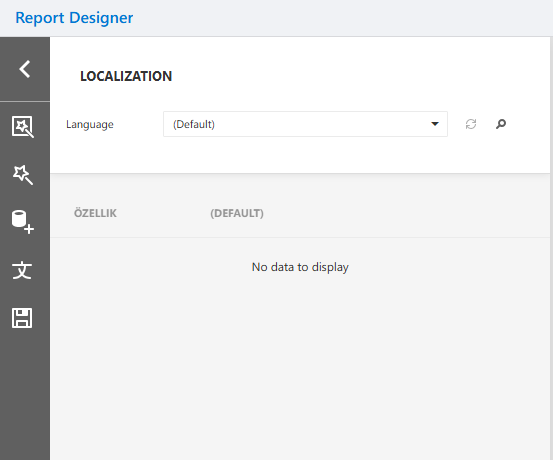
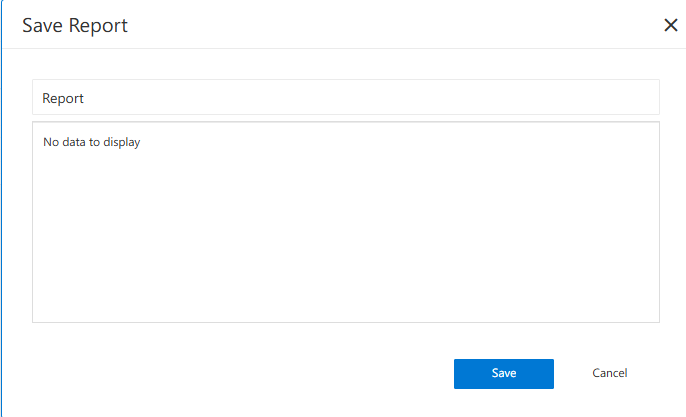
Localization and Saving Reports
The localization panel allows translation of report text elements into different languages.
After finalizing your design, click the Save button to store your report in the project.
Toolbar Items
The report designer's toolbar includes:
- Zoom in/out
- Page navigation
- Add/remove bands
- Undo/redo
- Layering and alignment tools
These help manage layout efficiently.
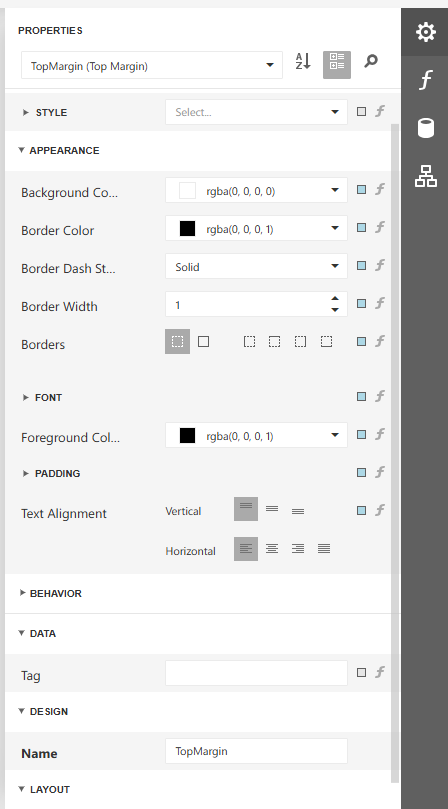
Properties Panel
The Properties Panel provides detailed control over selected elements.
You can customize:
Style: Apply predefined or custom stylesLayout: Padding, margin, alignmentFont & Appearance: Borders, colors, fontsBehavior: Visibility, conditional printingData Binding: Link data fields
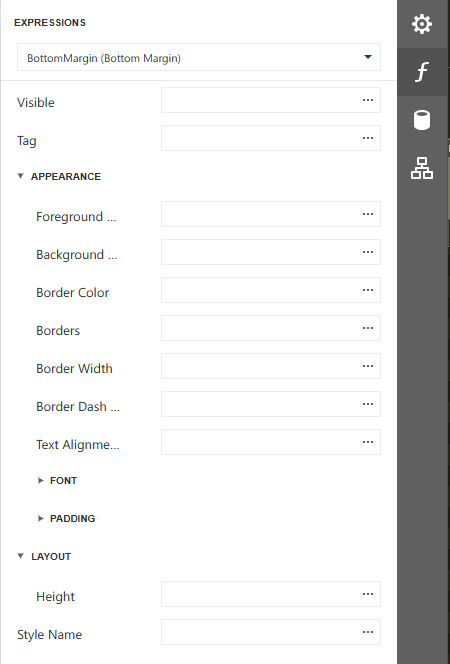
Expressions
You can insert formulas or dynamic expressions into fields using the Expression Editor.
Useful for:
- Conditional formatting
- Custom calculations
- Dynamic values (e.g., Today’s date)
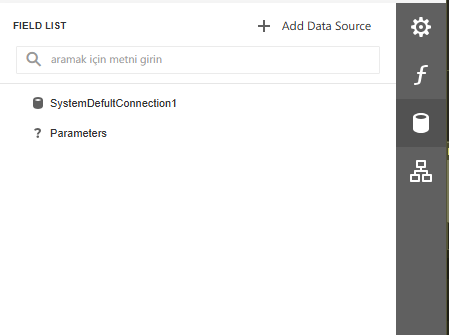
Field List
The Field List panel shows the structure of your bound data sources.
You can:
- Drag fields directly into the design surface
- Add new data sources
- Define parameters (for filtering, user input, etc.)
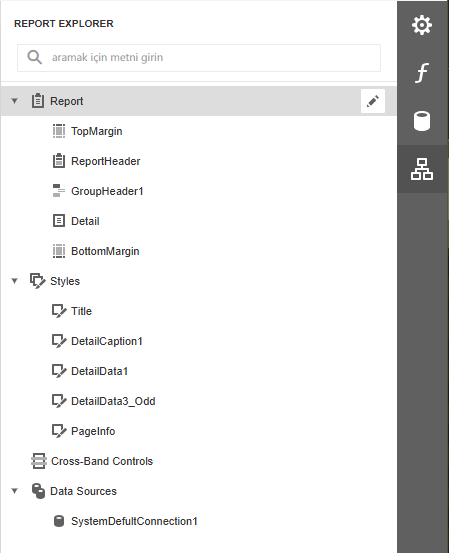
Report Explorer
This panel displays the hierarchical layout of your report:
- TopMargin, Detail, BottomMargin bands
- ReportHeader/Footer
- Styles and formatting
- Data sources
- Group headers and footers
Helps you organize large reports effectively.
Previewing the Report
Use the Preview tab or button to see how the report looks with real data.
The preview simulates:
- Layout and spacing
- Fonts and styles
- Calculated fields
- Repeating rows (if any)
Always test here before final deployment.
Best Practices
- Always test with live or sample data.
- Use consistent styles for a clean look.
- Organize content using bands (Header, Detail, Footer).
- Prefer wizard-based setup for beginners.
- Use parameters to build interactive reports.
- Use expression bindings for dynamic logic.
FAQs
- Can I preview a report before saving it?
- What is the Report Designer?
- What types of data sources can be used in reports?